Tunable workload
toy-load exposes CPU, sleep, jitter, payload, and error-rate knobs plus health, readiness, and Prometheus endpoints.
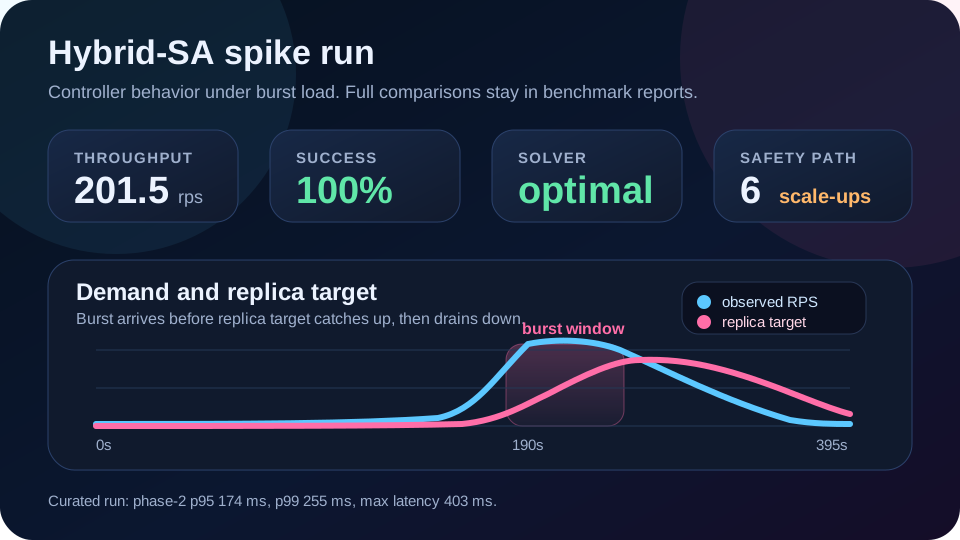
On a tracked 200 rps spike, a short-horizon MPC controller cut p95 latency by 38% against the HPA baseline. On a 30 s burst it lost — new Pods became Ready about 40 s after the decision. Both runs are reproducible from this repository.
A Go workload (toy-load) with tunable CPU, sleep, jitter, payload, and error-rate; a Python short-horizon MPC controller; one curated MPC-vs-HPA spike pair with raw traces and Grafana figures; and an offline simulator for sweeps without a cluster. Every figure links back to the source path that produced it.
Designed to probe knobs, baselines, and failure cases — not to replace the HPA in production.
toy-load exposes CPU, sleep, jitter, payload, and error-rate knobs plus health, readiness, and Prometheus endpoints.
Replay a recorded load against the HPA and against the MPC controller; compare p95, p99, success rate, and replica trajectory.
Every published number cites the run that produced it. Missing benchmark cells are kept visible instead of being implied.
The demo explains repository value without claiming production readiness.
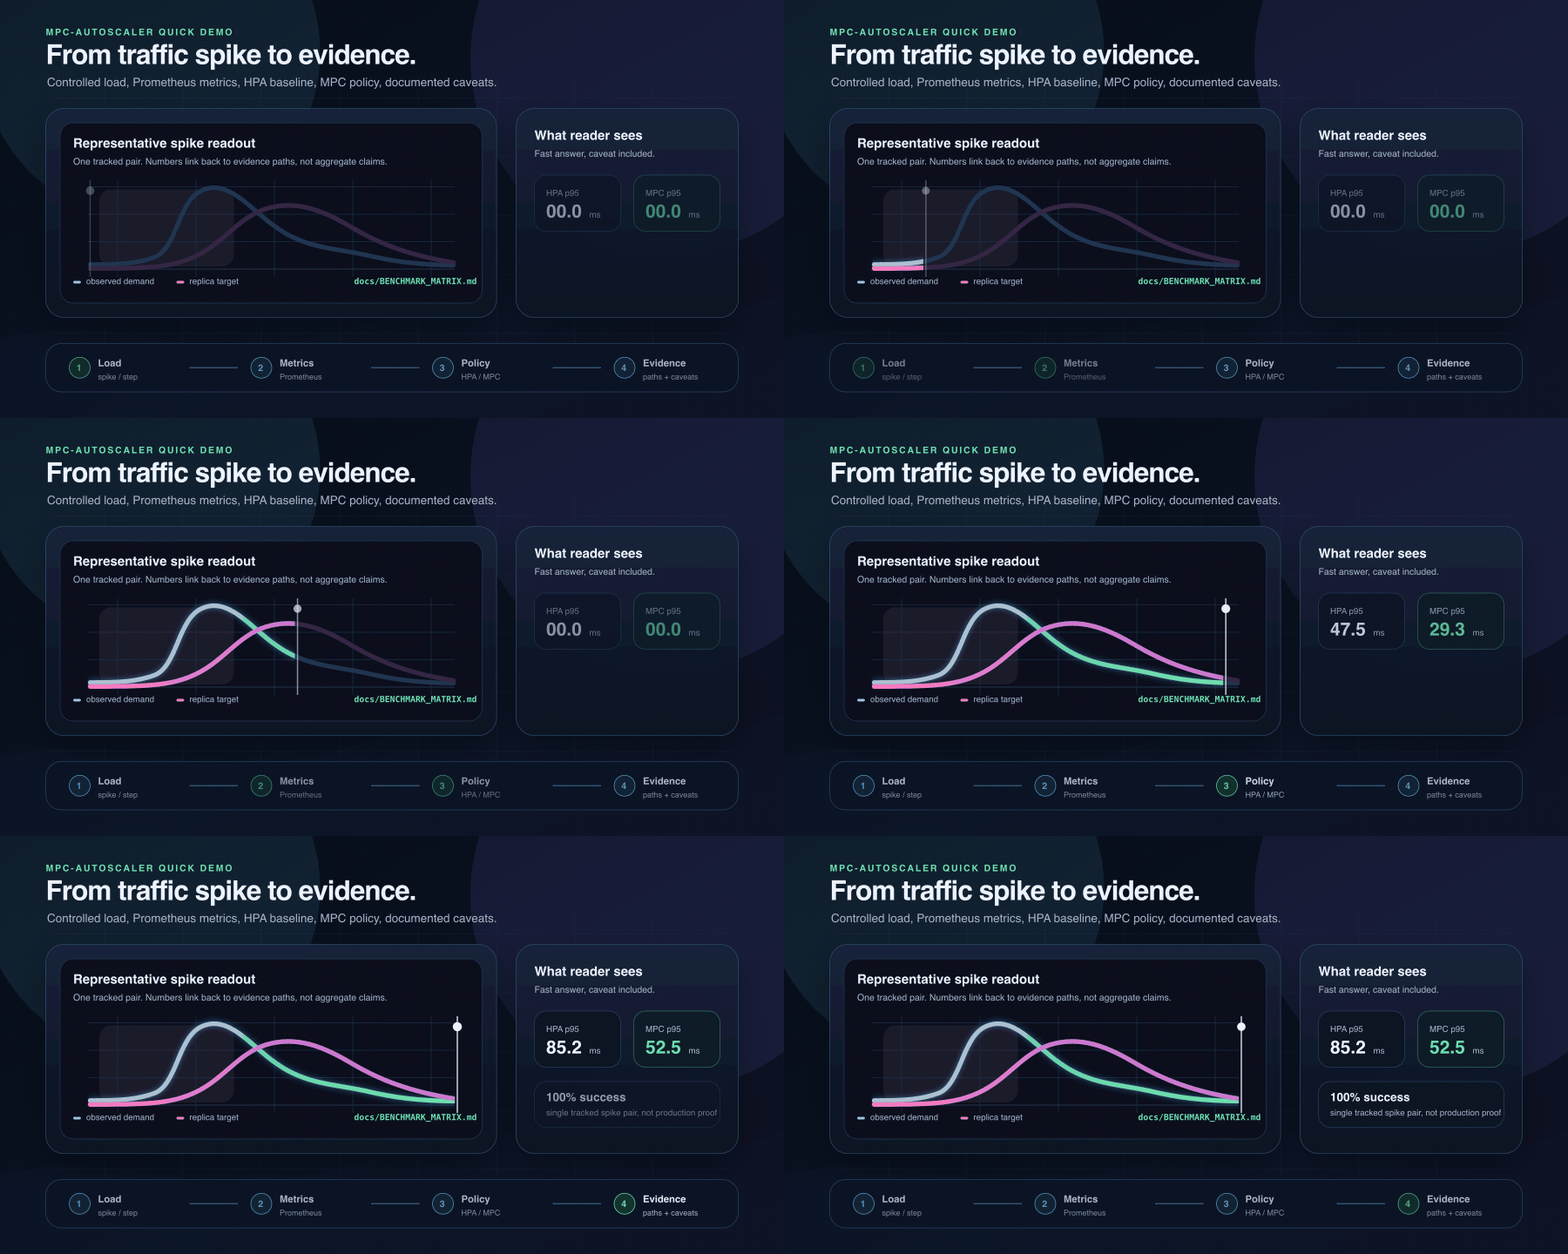
The benchmark matrix separates public numeric values from indexed evidence roots, so the current spike pair stays honest.
Every path supports one research question: what should scale, when, and under which assumptions?
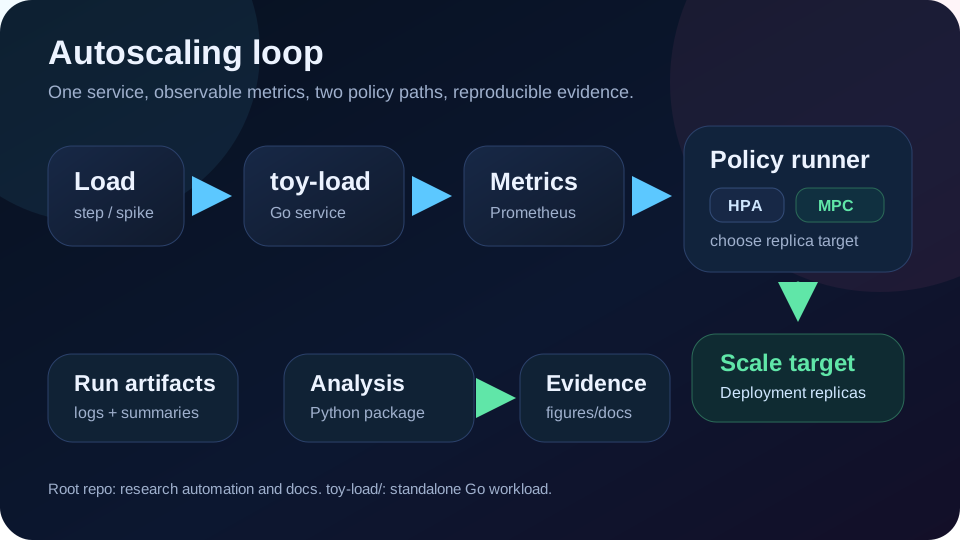
Follow demand through toy-load, Prometheus metrics, HPA, MPC, and saved analysis artifacts.
Start local, move to offline simulation, then rebuild saved evidence or live cluster runs.
Charts point to committed sources and evidence roots; bulky raw artifacts stay out of Git.
Release, CI, security scans, Pages, roadmap, issue templates, and GHCR image are wired as real project infrastructure.
The highest-value input is specific methodology criticism: better baselines, traces, comparators, failure cases, and evidence tables.
Many starter tasks need only one verified documentation, link, metric, setup, or example improvement.
Figures summarize live runs, release automation, and reproducibility boundaries. Result claims stay tied to documented evidence paths.
Checksums, binaries, Helm package, GHCR image, SBOM, and provenance are published.